Isoforom Switch Analysis
WANG Ziyi
Date: 18 5月 2022
ENSG00000205309
1 Isoform Switch
Summary Plot
Only the isoforms with fraction > 5% are shown below.
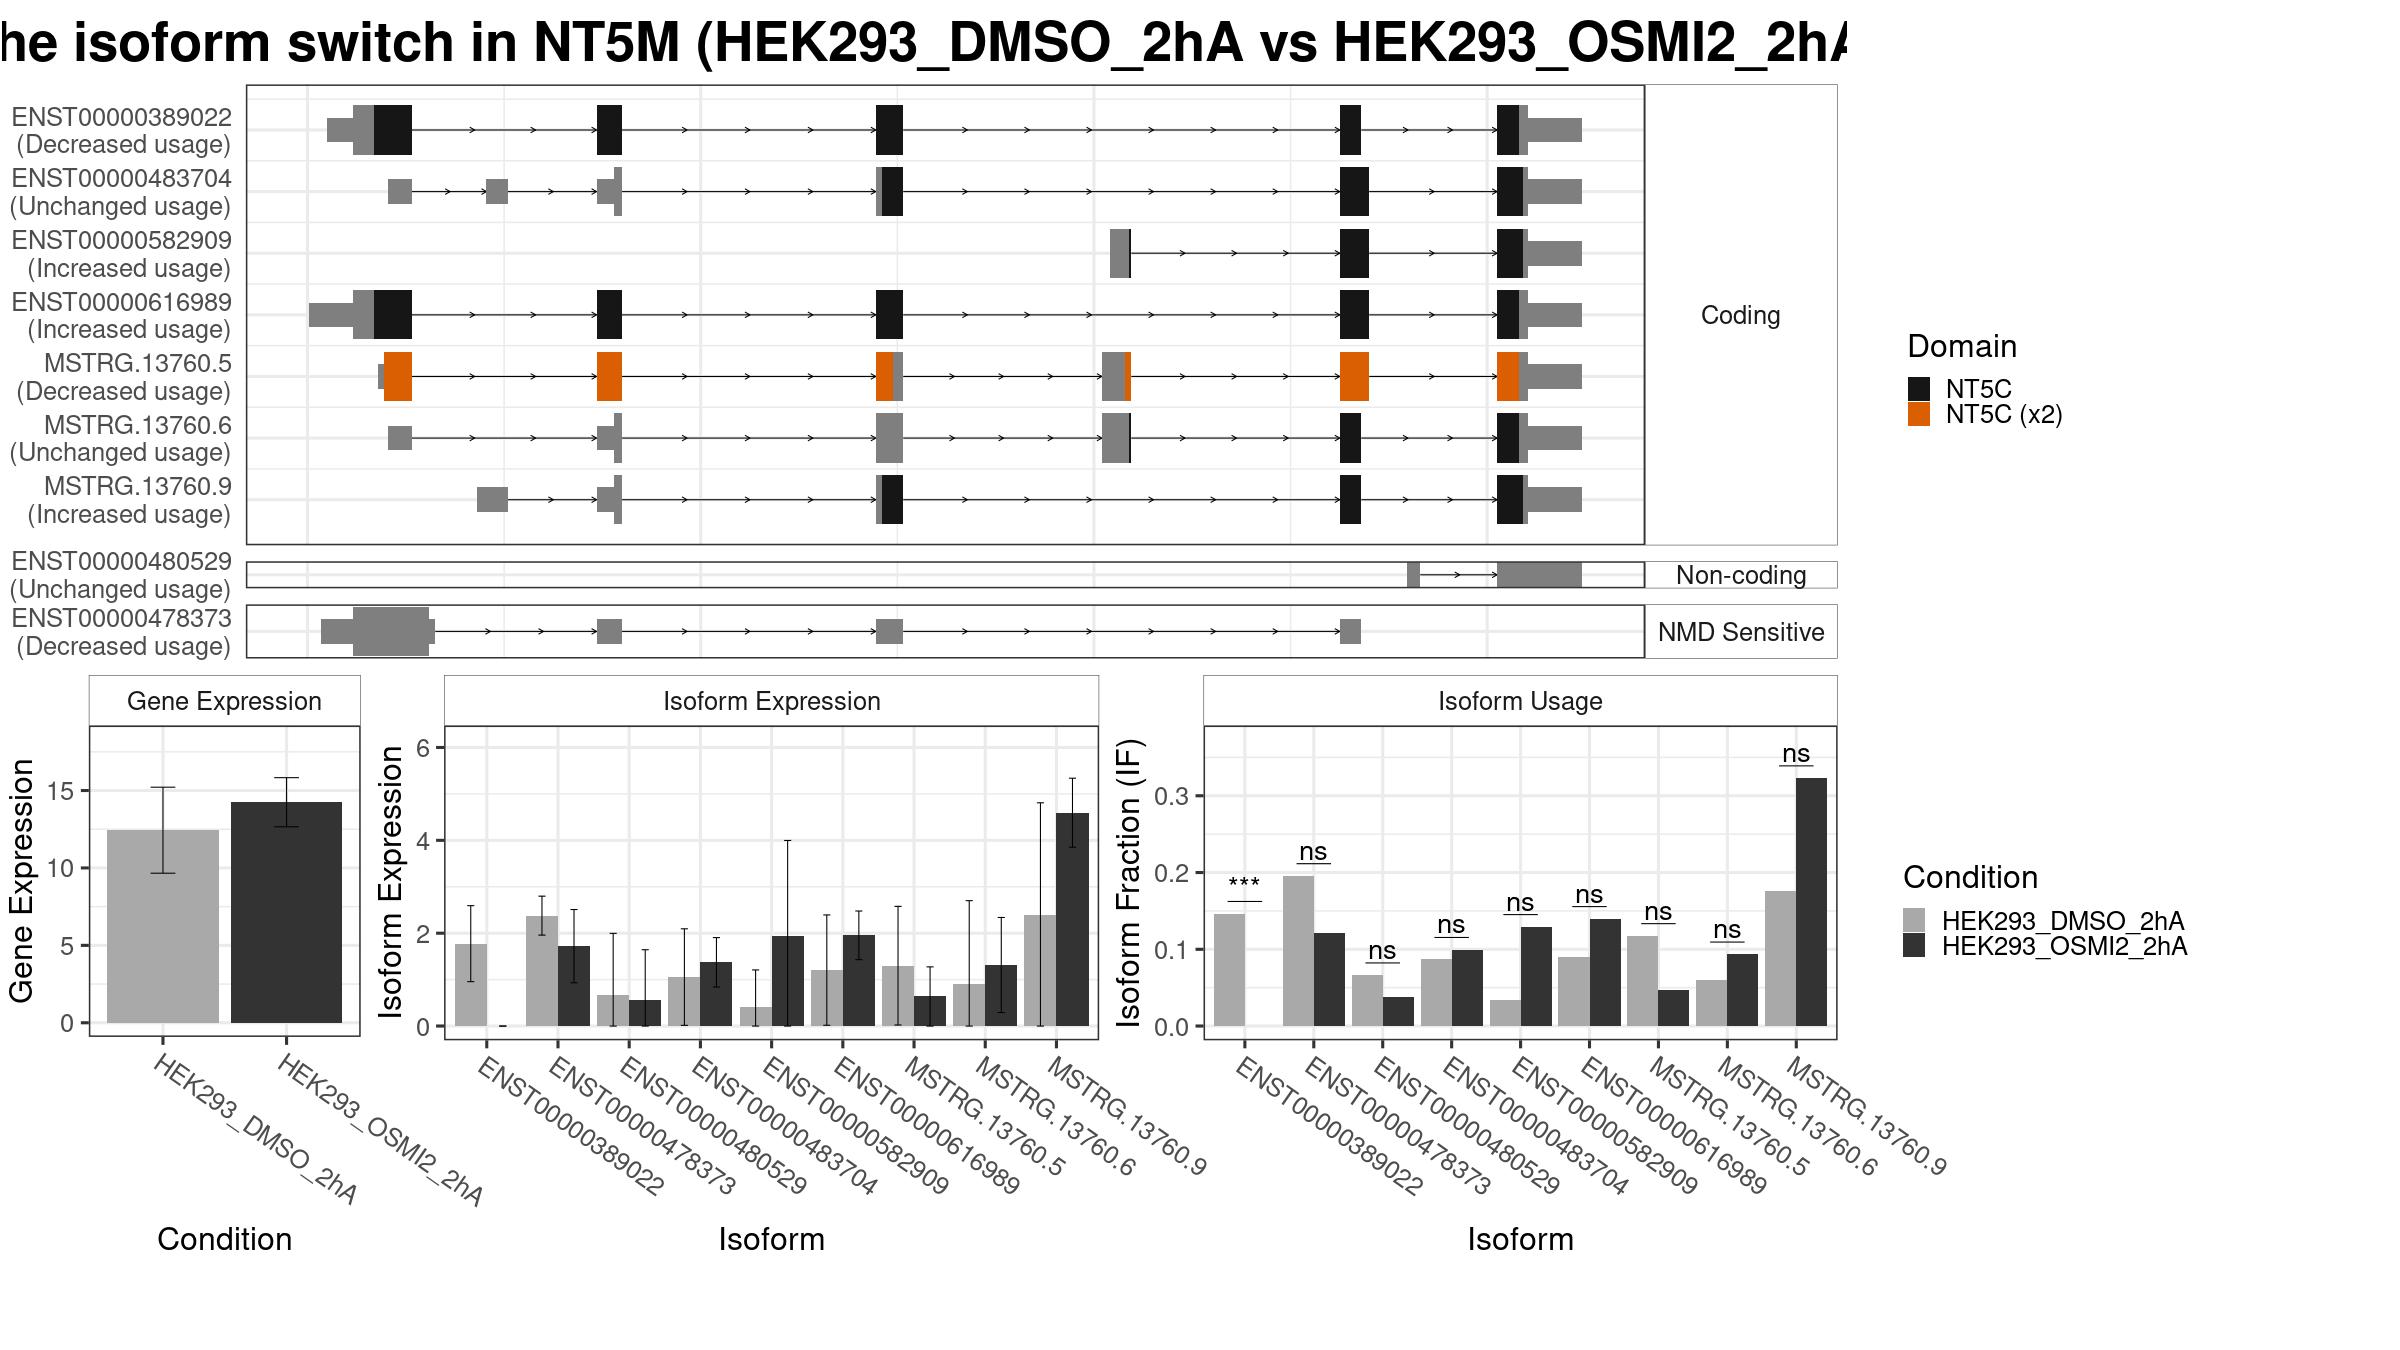
Notes on IDR and IDR_w_binding: As the prediction of Intrinsically Disordered Regions (IDR) and Intrinsically Disordered Binding Regions (IDBR) are done by two different tools we require two things to annotate the Intrinsically Disordered Binding Regions (IDBR). Firstly the IDBR (predicted by ANCHOR2) must be a region of at least 15 amino acids (after the smoothing). Secondly the fraction of the IDBR which overlaps the IDR predictions (done by IUPred3, again after smoothing) must be at least 80%. When that is the case the IDR type will be annotated as “IDR_w_binding_region” instead of just “IDR”. The current default parameters have not been rigorously tested and should be considered experimental.
For the function of any other domain, please Click HERE to search it through Pfam database.
Results
| isoform_id | gene_id | condition_1 | condition_2 | gene_name | gene_biotype | iso_biotype | gene_overall_mean | gene_value_1 | gene_value_2 | gene_stderr_1 | gene_stderr_2 | gene_log2_fold_change | iso_overall_mean | iso_value_1 | iso_value_2 | iso_stderr_1 | iso_stderr_2 | iso_log2_fold_change | IF_overall | IF1 | IF2 | dIF | isoform_switch_q_value | gene_switch_q_value | PTC | codingPotential |
|---|---|---|---|---|---|---|---|---|---|---|---|---|---|---|---|---|---|---|---|---|---|---|---|---|---|---|
| ENST00000389022 | ENSG00000205309 | HEK293_DMSO_2hA | HEK293_OSMI2_2hA | NT5M | protein_coding | protein_coding | 7.399297 | 12.43758 | 14.24466 | 1.417314 | 0.8099125 | 0.1955687 | 0.3930460 | 1.7747029 | 0.0000000 | 0.4175014 | 0.0000000 | -7.4795401 | 0.05212500 | 0.1462000 | 0.00000000 | -0.14620000 | 2.771112e-11 | 2.771112e-11 | FALSE | TRUE |
| ENST00000478373 | ENSG00000205309 | HEK293_DMSO_2hA | HEK293_OSMI2_2hA | NT5M | protein_coding | nonsense_mediated_decay | 7.399297 | 12.43758 | 14.24466 | 1.417314 | 0.8099125 | 0.1955687 | 1.1987065 | 2.3780543 | 1.7200166 | 0.2139184 | 0.4025671 | -0.4650497 | 0.16955833 | 0.1953667 | 0.12083333 | -0.07453333 | 7.452864e-01 | 2.771112e-11 | TRUE | FALSE |
| ENST00000483704 | ENSG00000205309 | HEK293_DMSO_2hA | HEK293_OSMI2_2hA | NT5M | protein_coding | nonsense_mediated_decay | 7.399297 | 12.43758 | 14.24466 | 1.417314 | 0.8099125 | 0.1955687 | 0.5181667 | 1.0552176 | 1.3732433 | 0.5302850 | 0.2715006 | 0.3769068 | 0.06416250 | 0.0877000 | 0.09930000 | 0.01160000 | 9.247268e-01 | 2.771112e-11 | FALSE | TRUE |
| ENST00000582909 | ENSG00000205309 | HEK293_DMSO_2hA | HEK293_OSMI2_2hA | NT5M | protein_coding | processed_transcript | 7.399297 | 12.43758 | 14.24466 | 1.417314 | 0.8099125 | 0.1955687 | 0.3485277 | 0.4083856 | 1.9488006 | 0.4083856 | 1.0451083 | 2.2270654 | 0.03909167 | 0.0339000 | 0.12906667 | 0.09516667 | 9.229573e-01 | 2.771112e-11 | FALSE | TRUE |
| ENST00000616989 | ENSG00000205309 | HEK293_DMSO_2hA | HEK293_OSMI2_2hA | NT5M | protein_coding | protein_coding | 7.399297 | 12.43758 | 14.24466 | 1.417314 | 0.8099125 | 0.1955687 | 1.0559471 | 1.2053240 | 1.9538406 | 0.6063107 | 0.2670972 | 0.6923369 | 0.13352083 | 0.0894000 | 0.13950000 | 0.05010000 | 9.229573e-01 | 2.771112e-11 | FALSE | TRUE |
| MSTRG.13760.5 | ENSG00000205309 | HEK293_DMSO_2hA | HEK293_OSMI2_2hA | NT5M | protein_coding | 7.399297 | 12.43758 | 14.24466 | 1.417314 | 0.8099125 | 0.1955687 | 0.6470430 | 1.2998956 | 0.6373739 | 0.6519347 | 0.3251850 | -1.0167807 | 0.09971667 | 0.1172333 | 0.04666667 | -0.07056667 | 9.275716e-01 | 2.771112e-11 | FALSE | TRUE | |
| MSTRG.13760.9 | ENSG00000205309 | HEK293_DMSO_2hA | HEK293_OSMI2_2hA | NT5M | protein_coding | 7.399297 | 12.43758 | 14.24466 | 1.417314 | 0.8099125 | 0.1955687 | 2.1559907 | 2.3955122 | 4.5949232 | 1.2309874 | 0.3789190 | 0.9368330 | 0.30640417 | 0.1762333 | 0.32286667 | 0.14663333 | 9.229573e-01 | 2.771112e-11 | FALSE | TRUE |
- Note:
- The comparisons made can be identified as “from ‘condition_1’ to ‘condition_2’”, meaning ‘condition_1’ is considered the ground state and ‘condition_2’ the changed state. This also means that a positive dIF value indicates that the isoform usage is increased in ‘condition_2’ compared to ‘condition_1’. Since the ‘isoformFeatures’ entry is the most relevant part of the switchAnalyzeRlist object, the most-used standard methods have also been implemented to work directly on isoformFeatures.
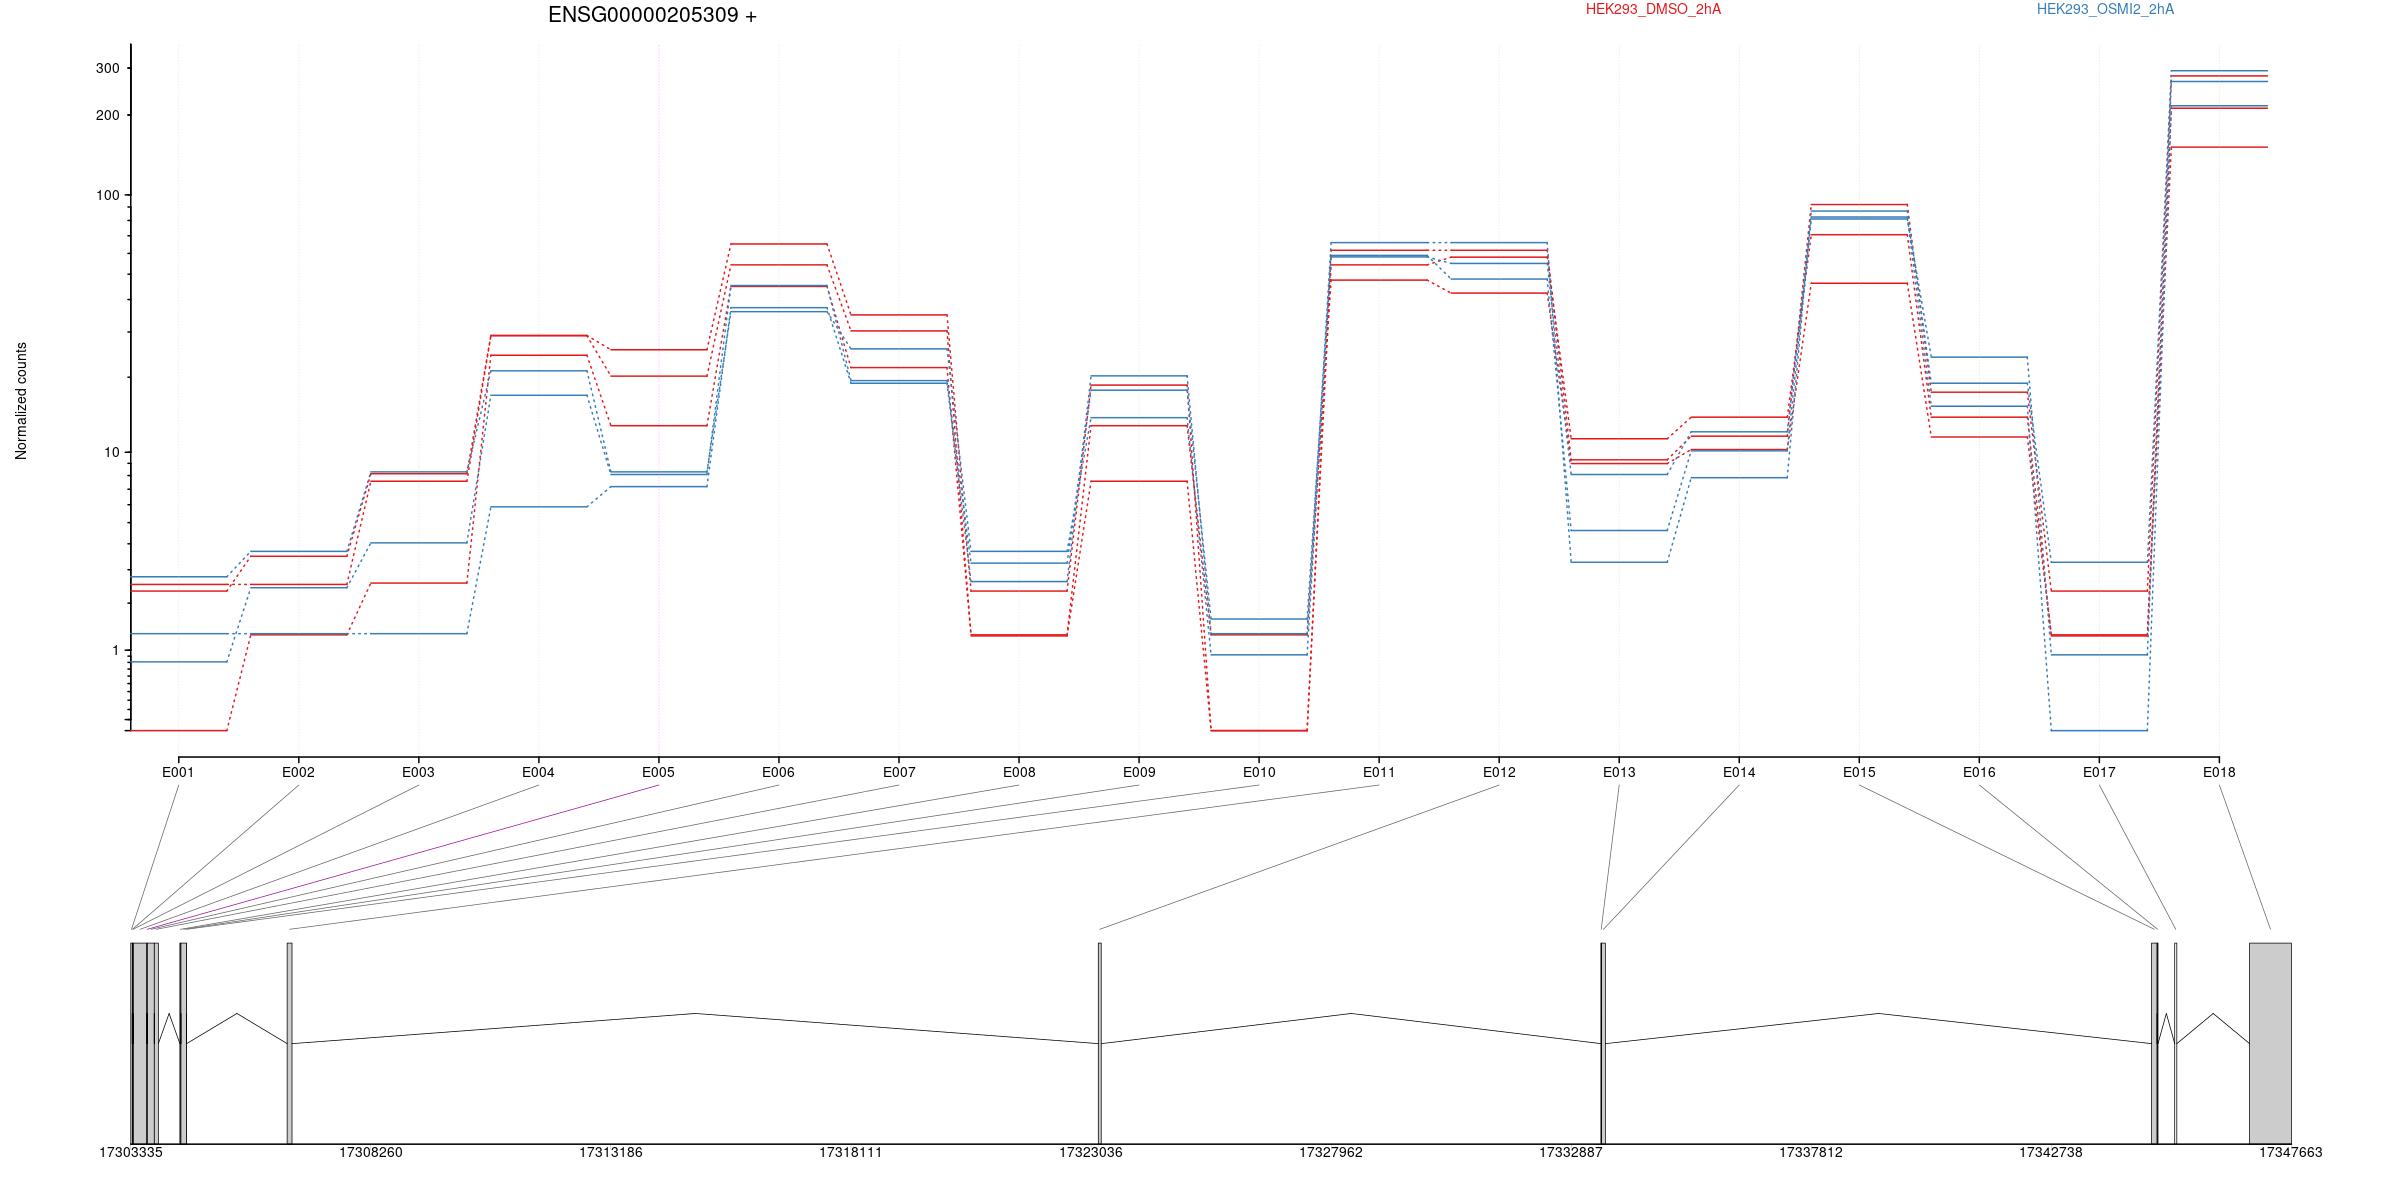
2 Differential Exon Usage
Counts
All exons whithin this gene region are shown and numbering below.
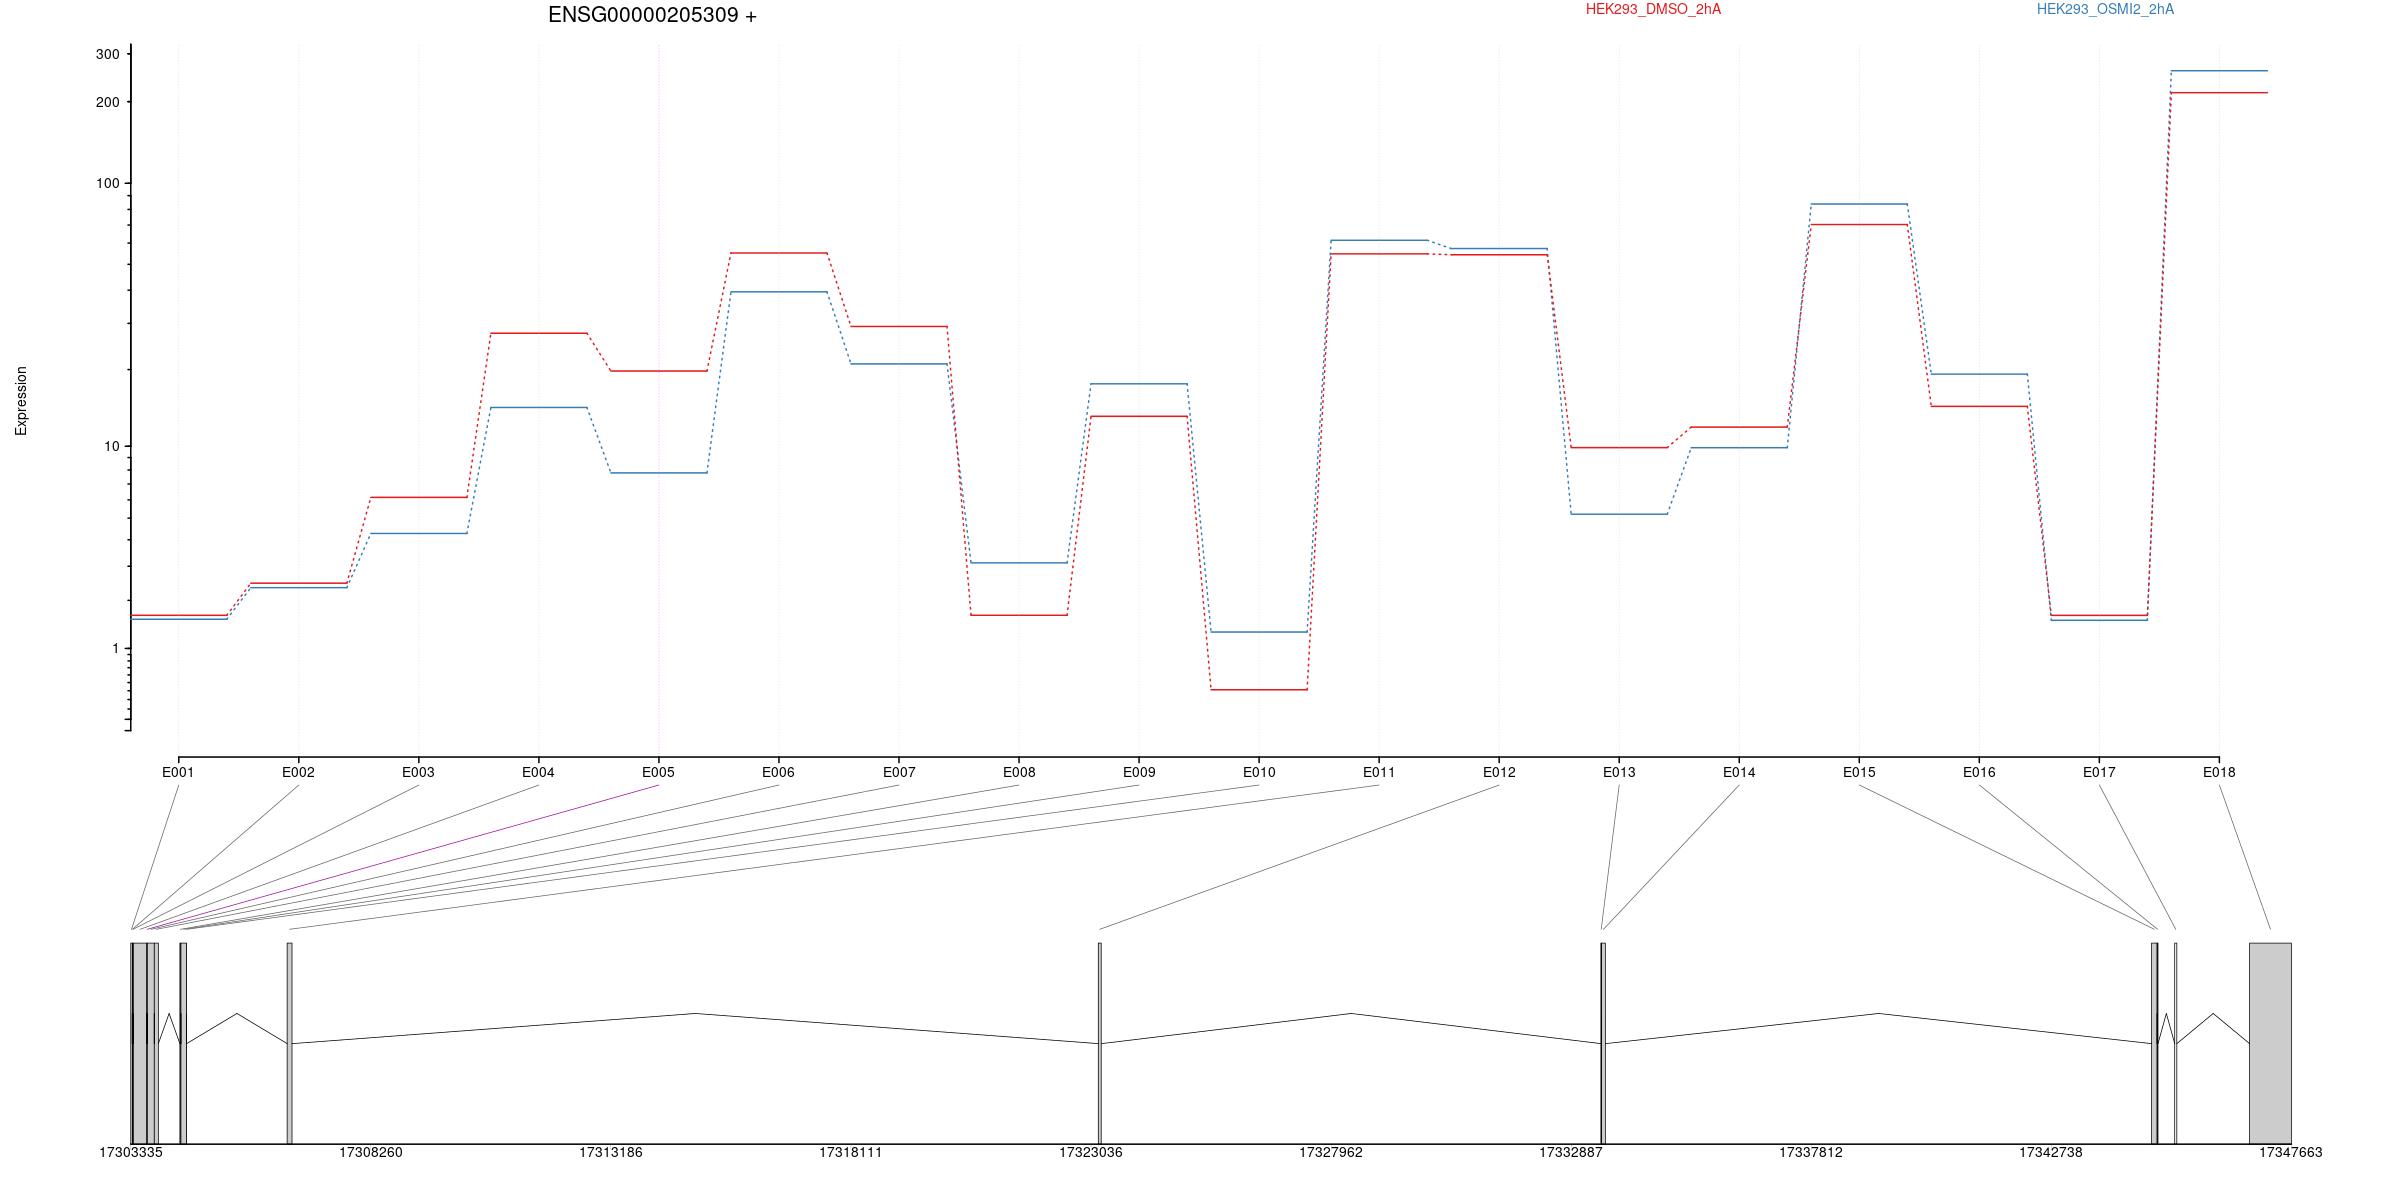
Expression
All exons whithin this gene region are shown and numbering below.
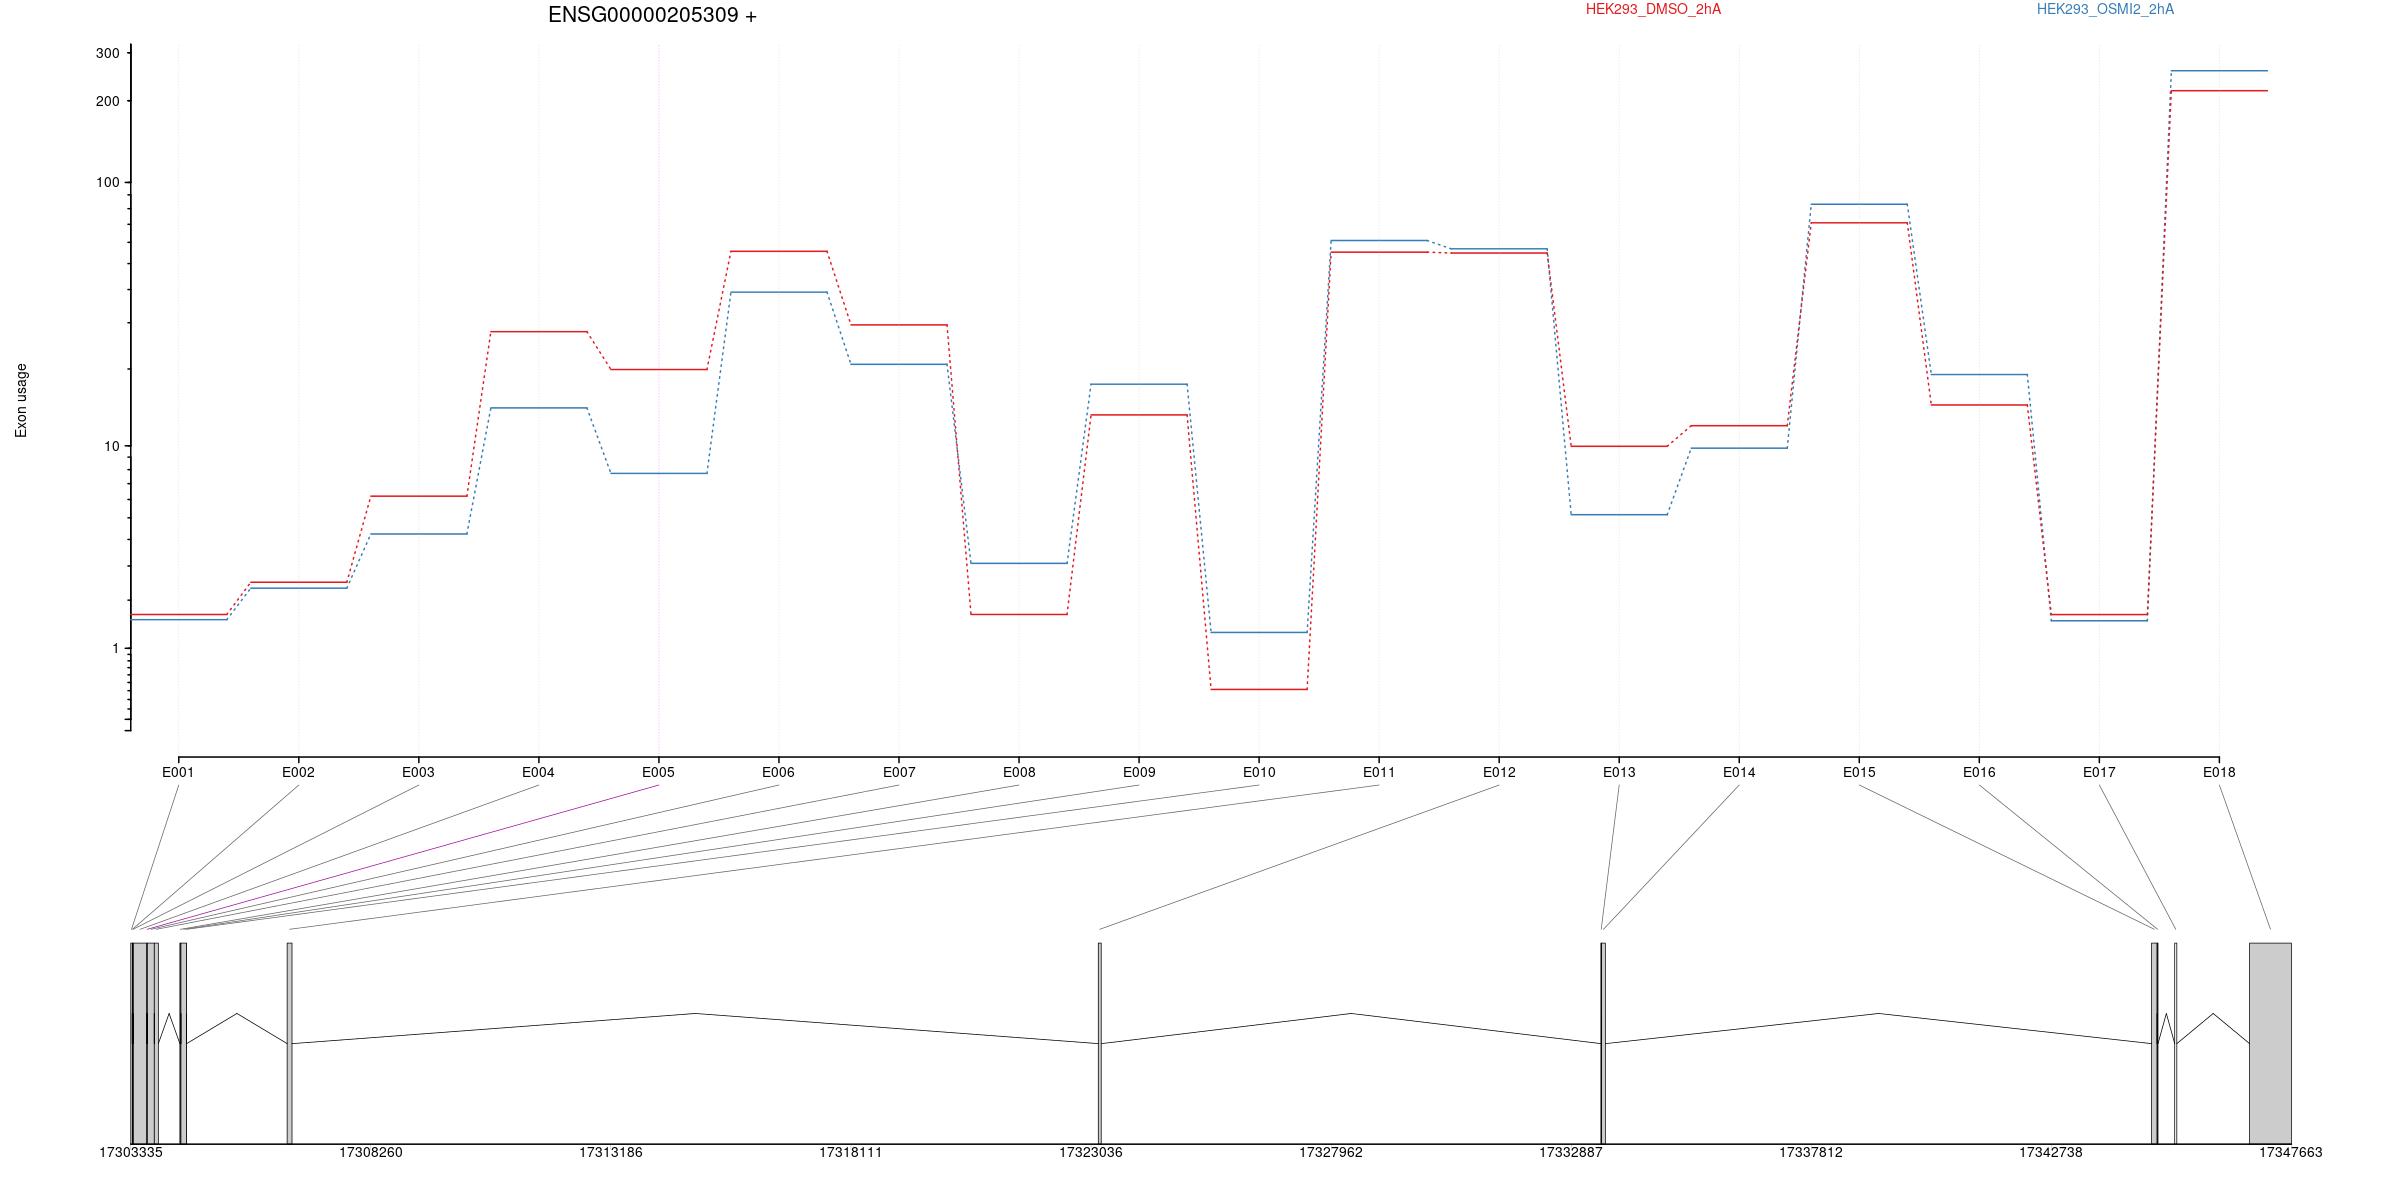
Splicing
All exons whithin this gene region are shown and numbering below.
Transcripts
All isoforms whithin this gene region are shown below.
![]()
Results
| groupID | featureID | exonBaseMean | dispersion | pvalue | padj | seqnames | start | end | width | strand | HEK293_OSMI2_2hA | HEK293_DMSO_2hA | log2fold_HEK293_DMSO_2hA_HEK293_OSMI2_2hA |
|---|---|---|---|---|---|---|---|---|---|---|---|---|---|
| ENSG00000205309 | E001 | 1.6215691 | 0.0105863133 | 8.959431e-01 | 17 | 17303335 | 17303365 | 31 | + | 0.406 | 0.425 | 0.102 | |
| ENSG00000205309 | E002 | 2.4522716 | 0.0077065756 | 8.736999e-01 | 0.99995031 | 17 | 17303366 | 17303372 | 7 | + | 0.521 | 0.543 | 0.102 |
| ENSG00000205309 | E003 | 5.3203478 | 0.0809871117 | 4.075725e-01 | 0.99995031 | 17 | 17303373 | 17303389 | 17 | + | 0.719 | 0.857 | 0.549 |
| ENSG00000205309 | E004 | 21.0884802 | 0.0628271523 | 2.617249e-02 | 0.93191272 | 17 | 17303390 | 17303664 | 275 | + | 1.180 | 1.459 | 0.973 |
| ENSG00000205309 | E005 | 13.6963449 | 0.0017761876 | 3.072667e-05 | 0.06520019 | 17 | 17303665 | 17303677 | 13 | + | 0.940 | 1.320 | 1.367 |
| ENSG00000205309 | E006 | 47.1235522 | 0.0013445184 | 2.337183e-03 | 0.46639567 | 17 | 17303678 | 17303817 | 140 | + | 1.603 | 1.753 | 0.507 |
| ENSG00000205309 | E007 | 25.1893911 | 0.0012121844 | 2.803857e-02 | 0.94317140 | 17 | 17303818 | 17303901 | 84 | + | 1.339 | 1.484 | 0.498 |
| ENSG00000205309 | E008 | 2.4003470 | 0.0073301328 | 2.800909e-01 | 0.99995031 | 17 | 17304342 | 17304363 | 22 | + | 0.612 | 0.425 | -0.897 |
| ENSG00000205309 | E009 | 15.1435916 | 0.0023491191 | 2.340910e-01 | 0.99995031 | 17 | 17304364 | 17304477 | 114 | + | 1.267 | 1.154 | -0.397 |
| ENSG00000205309 | E010 | 0.8544116 | 0.0153505034 | 2.645489e-01 | 17 | 17304478 | 17304481 | 4 | + | 0.359 | 0.151 | -1.632 | |
| ENSG00000205309 | E011 | 57.7517197 | 0.0006268627 | 4.441128e-01 | 0.99995031 | 17 | 17306543 | 17306643 | 101 | + | 1.792 | 1.749 | -0.144 |
| ENSG00000205309 | E012 | 55.1461098 | 0.0011314311 | 8.790932e-01 | 0.99995031 | 17 | 17323185 | 17323245 | 61 | + | 1.762 | 1.746 | -0.053 |
| ENSG00000205309 | E013 | 7.6001135 | 0.0144672790 | 4.025160e-02 | 0.99673612 | 17 | 17333496 | 17333510 | 15 | + | 0.790 | 1.040 | 0.949 |
| ENSG00000205309 | E014 | 10.9790774 | 0.0027731288 | 3.749432e-01 | 0.99995031 | 17 | 17333511 | 17333588 | 78 | + | 1.033 | 1.115 | 0.298 |
| ENSG00000205309 | E015 | 76.5236138 | 0.0005364392 | 1.189280e-01 | 0.99995031 | 17 | 17344794 | 17344908 | 115 | + | 1.925 | 1.857 | -0.229 |
| ENSG00000205309 | E016 | 16.8547730 | 0.0016208434 | 2.148618e-01 | 0.99995031 | 17 | 17344909 | 17344926 | 18 | + | 1.302 | 1.191 | -0.392 |
| ENSG00000205309 | E017 | 1.5097398 | 0.0717480659 | 8.444817e-01 | 17 | 17345269 | 17345312 | 44 | + | 0.402 | 0.424 | 0.123 | |
| ENSG00000205309 | E018 | 236.7999721 | 0.0044010951 | 1.541386e-02 | 0.83687587 | 17 | 17346805 | 17347663 | 859 | + | 2.413 | 2.340 | -0.243 |